

Posted on Friday, Jan 19th, 2024
Introduction to Jasper iReport Designer: Unveiling Its Lifecycle and Key Report Elements
Spread the love
INTRODUCTION
Jasper iReport stands out as an open-source report designer tailored for JasperReports and JasperReports Server, facilitating a range of functionalities:1. Craft visually stunning layouts featuring charts, subreports, crosstabs, and images.
2. Seamlessly access data via XML Hibernate, JavaBeans, JDBC, TableModels, CSV, and custom sources.
3. Publish reports in various formats such as RTF, HTML, XHTML, CSV, XLS, XML, DOCX, OpenOffice, and more.
At the heart of Jasper iReport Designer lies Jasper Reports, serving as a foundational component. Integration with Java applications is effortlessly achieved, making it an accessible tool. Alternatively, for users desiring report utilization without custom application development, the option of employing Jasper Reports Server exists.
To summarize, Jasper iReportDesigner empowers users to design reports, execute them, and generate output within a Java application through Jasper Reports. Furthermore, secure report publication can be achieved using Jasper Reports, and for added interactivity, Jasper Server enables the incorporation of features like drill up and drill down capabilities into your reports.
Fundamentally, the cornerstone of report creation within this ecosystem is the element. Elements serve as the fundamental building blocks, capable of generating tables, containing text, displaying images, and more.
JASPER iREPORT LIFECYCLE
The Jasper iReport Lifecycle unfolds through distinct stages:1. Report Design
In this initial phase, the JRXML file is crafted, representing the report layout in XML format. Whether using a text editor or the Jasper iReport Designer, this file is manually created to define the visual structure of the report.2. Report Compilation
Transitioning to the compilation stage, the JRXML is transformed into a binary object known as the Jasper file. This compilation is performed for performance optimization, and Jasper files are essential components for deploying applications that execute the reports.3. Report Execution
This step involves populating the compiled report with data from the application. A designated class furnishes the necessary functions to fill in the required data. Simultaneously, a Jasper print file is generated, offering options for printing or exporting the finalized report.4. Report Export
The created Jasper print file can be exported to various formats using JasperExportManager. Jasper Reports supports multiple export options, enabling the representation of data in diverse formats for enhanced flexibility.JASPER iREPORT ELEMENTS
Jaspersoft Studio provides the flexibility of combining nine fundamental elements from the Jasper Reports Library to craft a wide array of reports: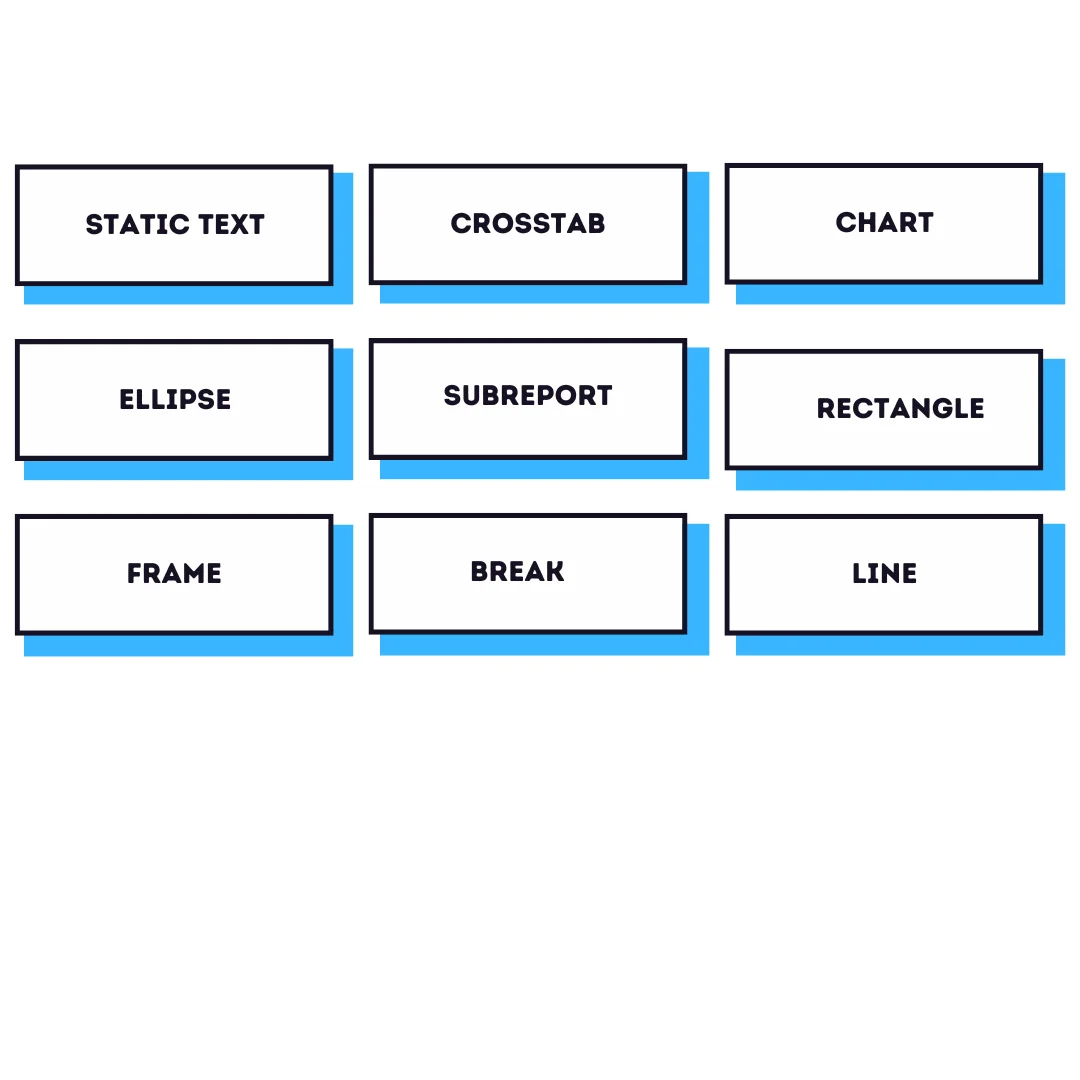 In addition to these predefined elements, Jasper iReports empowers developers to seamlessly integrate custom components and generic elements. This integration allows for the creation of tailored plug-ins, supported within Jaspersoft Studio. By incorporating the library into open or commercial applications, developers can generate reports designed with Jasper Reports Designer. These reports can then be displayed on-screen or exported to various final formats, including DOCX, OpenOffice, PDF, and more.
1. Basic Element Attributes
• Each element is equipped with a standard set of attributes or properties accessible through the element Properties view, with the specific attributes varying based on the element type.• Use the Appearance tab to customize text style, size, color, and position of the field.
• Utilize the Borders tab to set padding, border style, color, and width for the field.
• Employ the Static Text tab to specify unchangeable text for a field and manage its visual presentation.
• Utilize the Text Field tab to insert text into an element.
• Explore inherited attributes from another level through the Inheritance tab.
• Establish hyperlinks within an element using the Hyperlink tab.
• Access comprehensive information about the element through the Advanced tab.
2. Inserting, Selecting, and Positioning Elements
i. Element Insertion
Easily add elements by dragging them from the palette into the report band, and the newly added element will seamlessly integrate into the report editing area.ii. Element Selection
Click within the report editing area or navigate to the Outline view to select elements. Modify the element's size or position by dragging it as needed.iii. Element Positioning
Achieve precision in element placement within your report using various methods in Jaspersoft Studio.iv. Grid Alignment
Enable the grid in the design pane to align and position elements consistently on the page.v. Band and Frame Alignment
Element position values, usually defined by a band or frame element, are relative to the parent container, providing flexibility in placement.3. Text Elements
Text elements play a crucial role in report creation, with two specific types available:i. Static Text
This element displays non-dynamic text in reports. The Text property distinguishes it from generic text elements, as the specified text is not an expression. Enclose static text in double-quotes to adhere to Java or JavaScript syntax conventions.ii. Text Fields
These elements enable the printing of arbitrary text sections created through expressions. Expressions can include fields, variables, and parameters, allowing the incorporation of dynamic content with customizable formats.4. Graphic Elements
Graphic elements play a pivotal role in augmenting the visual aesthetics and improving the overall readability of reports. Elements such as rectangles and lines are not data-driven but serve as essential drawing objects to add structure, emphasis, and visual hierarchy to your reports.To seamlessly integrate these graphic elements, the process is straightforward. Utilize the Designer Palette, a comprehensive toolkit within Jaspersoft Studio, and effortlessly drag and drop the desired graphic elements onto the report editing area. This intuitive approach empowers report designers to enhance the layout, create visual separation, and emphasize key sections within the report. Furthermore, these graphic elements contribute to a more polished and professional presentation, ensuring that the information is not only conveyed effectively but is also visually engaging for the audience.
SUMMING UP
Blue Summit is dedicated to empowering individuals to make swift, informed decisions by integrating actionable insights seamlessly into their business processes. Explore our budget-friendly reporting and analytics platform designed to enhance decision-making.Discover the capabilities of the leading open-source reporting tool - Jasper Reports.
For additional details, feel free to reach out to us at inquiries@bluesummittech.com.
Blue Summit has collaborated with OdiTek Solutions, a frontline custom software development company. It is trusted for its high service quality and delivery consistency. Visit our partner's page today and get your business streamlined.
REFER TO OTHER RELEVANT CONTENTS

Jasper Reports Development
In the field of open source reporting, Jasper Reports is the most well-known and extensively utilized project. Thousands of software products include its reporting features, and it has been used in hundreds of thousands of projects as a production-grade reporting tool. As a result, Jaspersoft...
read moreLatest Insights


TESTIMONIAL

Andrew Buckland
We engaged Blue Summitt to set up our company’s IT infrastructure when we were in the process of embarking on a large clinical trial. A number of years later, Blue Summitt remains our vendor of choice for our IT needs. It is a testament to the quality of their work that we rarely need to call them to address ongoing issues, though when we do the response is always timely and we are always able to rely on their advice.

Katherine Leisinger
“Blue Summit has become a valued partner to IES. As our organization has scaled up, gone remote, and expanded internationally, they have provided strategic guidance to support our growth and changing needs. They not only provide superb day-to-day support desk services but also have served as business partners, undertaking projects like opening an office in the UK to help our expansion into Europe.”

Michelle Rodriguez
“I have been working with BST and using their apps for 5 years now and it has been very helpful in managing people and time on multiple sites for our company. The customer service that we receive from BST is outstanding and personable. I would highly recommend BST to any company looking for a timekeeping system with great customer relations.”

Somesh Siripuram
“Blue Summit are experts in IT and Strategy Consulting as well as Process management. We have indeed loved working with them, and wish to continue on the long and successful partnership.”